
Data Critique
What does our data look at?
Our dataset combines data from a few different sources to analyze the experience of healthcare by state in the United States. The data includes the following columns: star ratings for the quality of patient care, how often the home health team began their patients’ care in a timely manner, how often the home health team determined whether patients received a flu shot for the current flu season, how often patients got better at walking or moving around, how often patients got better at getting in and out of bed, how often patients got better at bathing, how often patients’ breathing improved, how often patients got better at taking their drugs correctly by mouth, how much medicare spends on an episode of care by agencies in this state, and several other relevant variables. The data also includes chronic respiratory disease rate across state, with data from 2021.
What are the original sources?
The majority of the data was sourced from The Center of Medicare & Medicaid Services (CMS), and is officially used on Medicare.gov. It gathers data to compare the quality of care provided by Medicare home healthcare around the nation. There is data for over 11,000 Home Health Agencies. There are three ways the data was generated, by gathering statistics on outcome measures, process measures, and patient-reported outcomes. This provides a broad overview of the healthcare process. The data appears to have been funded by the CMS, with the goal of being displayed on the Medicare website to show information about home healthcare providers individually. This data was gathered at the end of 2024, and was released in early January 2025.
What information is left out and cannot be revealed by this dataset?
The governmental funding of this data could lead to potential biases in that the columns might have been selectively chosen to ensure that Medicare looks good. A majority of the improvement outcomes have a 80-90% improvement rate, which could indicate that these were selected for a reason to highlight the effectiveness of Medicare. This could especially be the case given that the data was released at the very end of the Biden administration, while the incoming Trump administration had planned for significant cuts to governmental programs. The exact question that was asked in order to generate the patient satisfaction star rating is unknown, and it could be possible that the question was framed in a positive manner to influence respondents of the survey. Additionally, the dataset does not contain information about Puerto Rico, or any other US territory (except the Virgin Islands), so there are many people who are excluded from this dataset.
Credit: Pedal Chile.
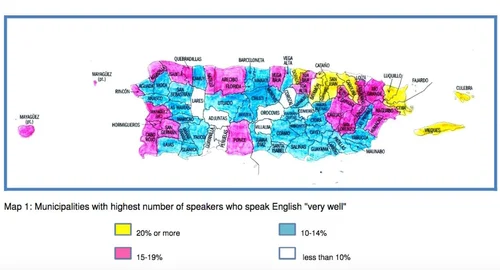
The dataset also does not indicate whether questions were asked in both Spanish and English, which would have been crucial to gather accurate data in Puerto Rico and other parts of the country that has Spanish-speaking individuals.
What does our second data set analyze?
The remainder of our data consists of chronic respiratory disease rates. There was a lot of information, which included chronic respiratory disease data across a large number of years. We selected a column which shows the probability of death from chronic respiratory diseases from 2021, as that was the most recent year on our dataset, and our other source contained data from 2024. We combined this column of the data with the data from the previous source by state.
Where does our second dataset originate from?
The original source for our data set evaluating statistics related to chronic respiratory diseases include the WHO mortality database, the World Bank Open Data, the European Health for All Database (HFA/DB), the CDC Wonder (USA), and the Health Indicators Warehouse (USA). Those who funded this dataset include The Institute for Health Metrics and Evaluation (IHME) (an independent global health research center at the University of Washington) and The Global Health Data Exchange (GHDx) (a data catalog created and supported by IHME). These funders seem relatively unbiased, as they are all sources that are hoping to further public health. In this part of the data, it is unlikely there is much bias.
What are the limitations of this dataset?
There is a limitation here, because 2021 data could have been slightly skewed if there were a higher percentage of people at risk for chronic respiratory diseases affected with COVID-19, which would have reduced the number of chronic respiratory diseases.
Credit: Pan American Health Organization.

Another potential limitation in this second source of data is the fact that a majority of our other data is about Medicare, which is solely about the population above the age of 65, while this data is general across the entire population of the state. If certain states have a higher or lower percentage of the population above the age of 65, this means that the chronic respiratory rate for Medicare recipients could be significantly different from the rate that we have added.
There is quite a bit of information that is not specified in our datasets, including age, gender, ethnicity, specific location within the state, and wealth. These factors could have a significant impact on the healthcare experience of individuals, and it is important to consider these factors through other scholarly articles as a narrative is built around this data. It is crucial to consider the intersectionality of individuals, which is not possible using solely the dataset.